

SuperGuide thanks Optimum Pensions for allowing us to share their LifeSpan Calculator with you.
This calculator helps you estimate how long you might live, based on the latest Life Tables from the Australian Bureau of Statistics (ABS) and the Australian Government Actuary.
However, these government estimates of potential lifespans are based on population averages for men and women. To give you a better idea of how long you might live, the LifeSpan Calculator also allows you to add key details about your health, lifestyle and marital status.
The aim of the calculator is to provide a more personalised estimate of how many years you might expect to live in retirement and how long your retirement income may need to last. It does this by taking into account your attitude to risk and desired level of confidence that your retirement income will last the distance.
For example, a 65-year-old woman today can expect to live to 87.8 on average, or an additional 22.8 years) but individual differences can make a big impact on your life expectancy.
Take Jennifer. Using the calculator, she keys in her age (65), marital status (single) and preferred retirement age (67). She also provides lifestyle information that indicates she is healthy and active with no medical conditions. According to the calculator:
- If she wants to be 90% confident that her savings will last until she dies, she needs to plan to live for 35 years in retirement until age 102. There is a 10% chance she will live longer than 102.
- If she wants to be 75% confident that her savings will last until she dies, she needs to plan to live for 32 years in retirement until age 99. There is a 25% chance she will live longer than 99.
- If she wants to be 50% confident that her savings will last until she dies, she needs to plan to live for 26 years in retirement until age 93. There is still a 50% chance she will live longer than 93.
Try out the calculator yourself below and download your results.
You can then use your results to help with your retirement income planning. There are some powerful free calculators around such as TelstraSuper’s Retirement lifestyle planner and Mercer’s Retirement income simulator.
Transcript
Tracey Spicer
Hi, I’m Tracey Spicer. How long are you going to live? I know it’s an impossible question to answer, and it’s a vexed issue when it comes to retirement planning. How long do you need to prepare for. To unpick this issue we’re joined by Jim Hennington. Jim’s done some modelling on this and he works with Optimum Pensions. Hi Jim.
Jim Hennington
Hi Tracey.
Tracey Spicer
We read a lot in the mass media about this concept of longevity. There’s always figures thrown out for men and for women. Is this information accurate?
Jim Hennington
Well, the figures are often accurate in the context of how they’re calculated, but how they used and how they’re interpreted can be quite different to the calculation methods. And that’s what I wanted to draw a bit of attention to. So, yeah, there’s a number of dimensions to life expectancy and quite a range. Despite we do have a life expectancy figure, there’s quite a range around that. And that’s what I’m keen to draw attention to.
Tracey Spicer
How much of a range is there and do too many people aim for the lower end of the range when doing their financial planning.
Jim Hennington
Well, the range is large. So I focus a lot on people who are at the point of retirement. So if we think about a 65 year-old as an example. So realistically, the range is anywhere between, you know, next week, right up to the end of the life tables, which is 109.
And yeah, we know that people’s life spans are anywhere in that range. As actuaries, we can look at historic data of how long do people live in the past. And we have projection models that say, OK, if we’ve got a 130,000 65 year-old females today, how many of them are likely to live up until each age. And there’s a kind of a natural curve to it.
So the average is life expectancy. But yeah, we were able to quantify what’s the range around that?
Tracey Spicer
Given that the standard deviation is quite broad, I mean, I could live, as you mentioned, until next week or until I’m in my 90s, how do we use this data when planning for our retirement?
Jim Hennington
So standard deviation is a way of measuring how spread out numbers are. So if you’ve got a low standard deviation, it means all the numbers tend to be pretty close to the average. And if you’ve got a high standard deviation, it means all the results are very spread out. So with life expectancy, the standard deviation around that is eight years. So that’s a statistical measure. And there’s lots of formulas and it’s a defined field. But in terms of interpreting that, that’s when we actually start to look at data points on the chart.
So for those 65 year-old female, the figures we’ve got, you know, there’s a 13% chance they live to more than one standard deviation above their life expectancy. So that comes to age 97. And there’s about a 16% chance they die somewhere between now and age 81. So it quickly gets quite mathematical. But the way to interpret it is, I guess about 70% of them will live to somewhere between 81 to 97.
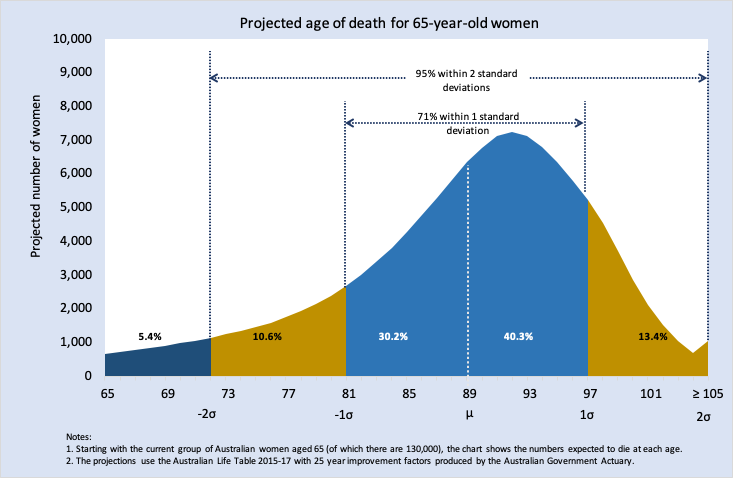
Source: Optimum Pensions
Tracey Spicer
And how do we as individuals use this data? What is your best advice? Because there is still a lot of unknowns.
Jim Hennington
That’s right. Yes. So that’s something Optimum Pensions are working on, is a calculator to help bring all this into a digestible way for people to personalise it and quantify it. So as an example, you can put in your age and a little bit of information about your lifestyle and health status can provide an average of how long you’re expected to live. Plus, it’ll give you some, you know, some confidence levels. So if you want to be 95% confident, here’s how long you should plan until or if you want to be 75% confident, here’s how long you should plan until.
I think, you know, some of this is deeply statistical, but there are tools coming available that help people apply it to them.
Tracey Spicer
Such a clever idea because it’s very personal isn’t it. And given the global pandemic, are these figures changing. Is there any early modelling on longevity, regardless of people’s gender, given what’s happening at the moment?
So the actuaries have got specialists, sort of task forces who are really looking at the pandemic. Constantly monitoring the data, helping insurance companies in particular to manage this, but from what I know so far, the total number of deaths caused by the pandemic doesn’t look like enough to really make a big difference to the overall life totals. The total population of the world is in the billions. The total number of deaths is still not enough to really change the life tables at this stage. That’s my understanding.
Tracey Spicer
That’s actually incredibly comforting. OK, one more question without notice this time, Jim, have you done, being an actuary, the figures on your life expectancy, how long have you going to live?
Jim Hennington
Yes, I have. And I guess it sort of comes back to that answer. There’s a range, there’s uncertainty. I remember looking at my daughter when she was born and looking at all the characteristics of her future life, and her life expectancy was about 100. Mine’s less than that. But I’m conscious there’s a bit of uncertainty to it, even as an actuary.
Tracey Spicer
Well, that is lovely to hear that about your daughter. And we always think about our children in relation to don’t we. Jim Hennington thank you so much for your time and analysis.
Jim Hennington
My pleasure. Thanks. Tracey.

Leave a Reply
You must be logged in to post a comment.