When it comes to superannuation and saving for retirement more generally, it’s the long term that counts.
That’s great in theory, but not so easy to swallow when markets plunge, your super balance takes a hit, and everyone around you is panicking.
In the short term, markets react and often overreact to the news of the day. Share prices soar on good economic data one day and plummet on news of rising interest rates the next.
In the long run, though, those daily fluctuations even out and the underlying value of investments shines through.
Weighing up long-term risk and returns
As Warren Buffett’s teacher, Benjamin Graham famously said: “In the short run the market is a voting machine but in the long run it’s a weighing machine.”
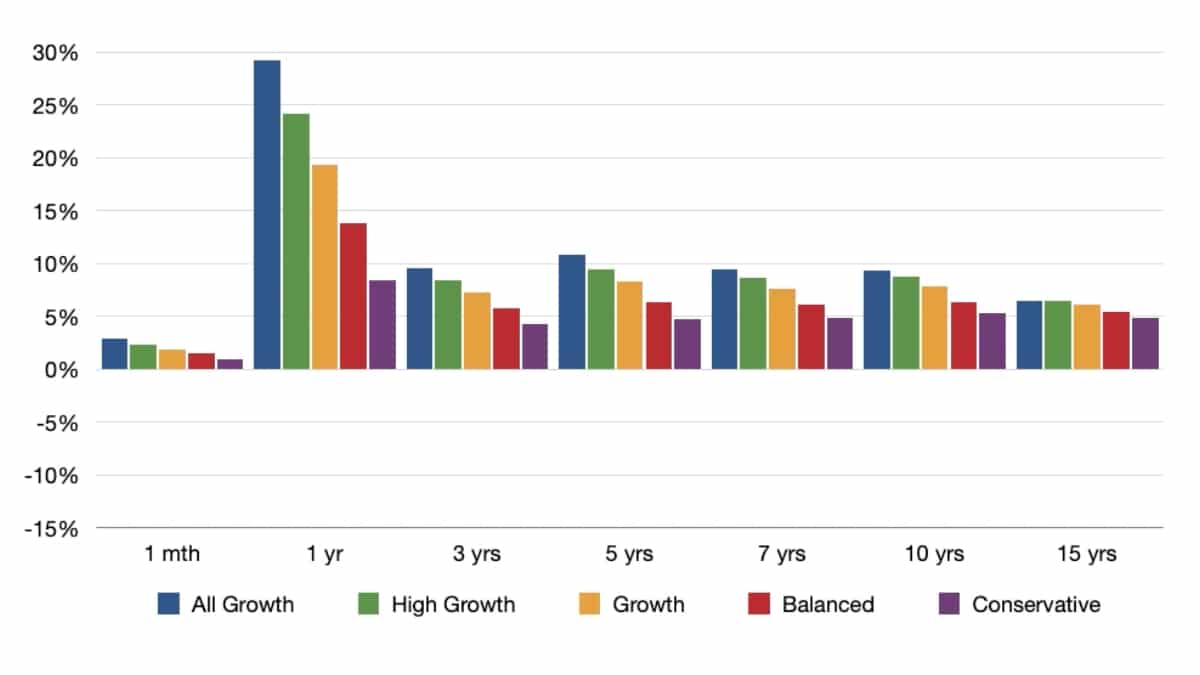
But don’t take his word for it. SuperGuide has prepared a visual representation of super fund performance over periods of one month to 15 years, for ten years to June 2025. We would like to thank Chant West for providing the data.
In the animated video below, the five coloured bars for each time period represent the five risk categories used by Chant West: Conservative (21–40% growth assets), Balanced (41–60% growth assets), Growth (61–80% growth assets), High Growth (81–95% growth assets), and All Growth (96–100% growth assets). The higher the level of growth assets such as shares and property, the higher the risk of short-term fluctuations and the higher the potential long-term returns.
As you can see on the left of the graph, over the past ten years returns over one month and one year whip around like the tail of an over-eager puppy. Predictably, the most volatile returns are for the All Growth and High Growth risk categories.
But shift your focus to the far right of the graph and returns over 15 years have been remarkably stable for the past ten years. As theory would predict, generally the higher the risk the higher the return.
There are exceptions though. You may notice that the All Growth category was not consistently first over 15 years. For example, between 2015 and 2017 the median High Growth and Growth options outperformed the All Growth category over 15 years.
However, it’s important to note that the animated graph only shows short- and long-term returns for the past ten years. If we had included returns for 15 or 20 years, it’s likely that the All Growth category would come out on top more often.
And that’s something to weigh up when choosing your investment option. As you get within a few years of retirement you may wish to reduce the risk of one or two bad years punching a hole in your savings, by selecting a lower-risk investment option. Younger super fund members can afford to ride out short-term fluctuations by focusing on the long-term rewards of higher risk investments.
Source: Chant West. Performance is shown net of investment fees and tax, and before administration and adviser commissions.
Get more guides like this with a free account
better super and retirement decisions.


Leave a Reply
You must be logged in to post a comment.