

In this guide
For the third year running, the Australian Prudential Regulation Authority (APRA) has applied heat to poor performing super funds with the release of its latest ‘heatmap’.
This year’s heatmap compares 69 MySuper products on investment performance, fees and costs, and sustainability. To help fund comparison, this year’s heatmap also includes each product’s result under APRA’s annual performance test.
However, multi-sector Choice investment options have been given a year to cool their heels. After being included for the first time last year, APRA has deferred its follow-up Choice heatmap until 2023.
How does the heatmap work?
After collating information from MySuper funds, the heatmap uses a graded colour system to visually compare how each fund performs from white (alright) to burnt red (likely to burn a hole in members’ retirement savings).
If you are a member of a MySuper fund or simply an interested bystander, you can access APRA’s MySuper Product Heatmap here.
Some of the key findings of APRA’s 2022 heatmap include:
- Fees and costs have fallen for most MySuper products. APRA estimates 8.1 million members (56% of member accounts) have experienced a drop in total fees in the 12 months to June 2022, for a total annual saving of $210 million.
- 28 MySuper products have closed since APRA published its first heatmap in 2019.
- 350,000 fewer members are in MySuper products with “significantly poor” investment performance than in 2021, but 800,000 remain in these underperforming products
Sustainability pressures exist across the industry, with most super funds posting negative returns over the past three years across one or more of the heatmap’s sustainability markers.
Who is the heatmap for?
As it stands, the heatmap appears to be aimed primarily at the super funds themselves, to spur underperforming funds to lift their game or face pressure from APRA to merge or leave the industry (as 28 already have).
APRA says the intended audience includes policymakers, advisers and employers. Certainly further refinements will be needed to make the heatmaps more accessible to fund members.
Although the heatmap is designed to highlight good and bad performance at a glance, it’s not that simple. To interpret the visuals, you need to wend your way through supporting material beginning with the Methodology Paper.
Heatmap puts pressure on poor performers to quit the scene
Since the publication of the first heatmap in 2019, 28 MySuper products have closed, merged or otherwise left the market, mostly because they were underperforming. However, the rate of fund exits is slowing, with just six in the past year, indicating that increased scrutiny is doing its job.
Overall, 1.5 million member accounts, containing $51.6 billion in member benefits, have been transferred to other, better performing, products.
APRA deputy chair, Margaret Cole says the heatmaps have been an important tool for improving performance, transparency and member outcomes, but more needs to be done.
“There are still hundreds of thousands of members in funds with sub-par investment performance, and the industry has serious sustainability issues to address.”
At the end of this article, you can discover the best and worst performing MySuper funds relative to the benchmark.
What is the difference between MySuper and Choice products?
MySuper products offer a single investment option and are designed to be simple, low-cost default products for members who don’t make an active decision on their investment strategy (although any member may choose to be in a MySuper product). As at June 2022, there were 69 MySuper products with 14.4 million member accounts and assets of $884 billion.
Choice products and options are those in which members have made an active decision to invest and are aimed at members seeking greater control and flexibility. They are more diverse and complex than MySuper products. Super fund trustees may offer multiple Choice products and within these products a wide range of investment options.
Choice investment options enable members to select investment options based on their risk profile, goals and personal circumstances. Choice members generally get access to a wider range of features than members of MySuper products, such as additional website functionality and member reporting.
While APRA has deferred the update of the Choice heatmap, it is committed to publishing it in 2023 with improved data collection.
Investment returns are the primary driver of underperformance
APRA argues performance should be looked at over a range of time horizons to see how products perform in different market environments. The latest heatmap assesses performance over 3, 5 and 8 years (7 years was the longest period available in 2021).
As you can see in the graphs below, investment returns even out over 8 years compared with a shorter term of 5 years. Long-term returns are more relevant due to the long-term nature of superannuation.
Investment returns (% of member accounts)
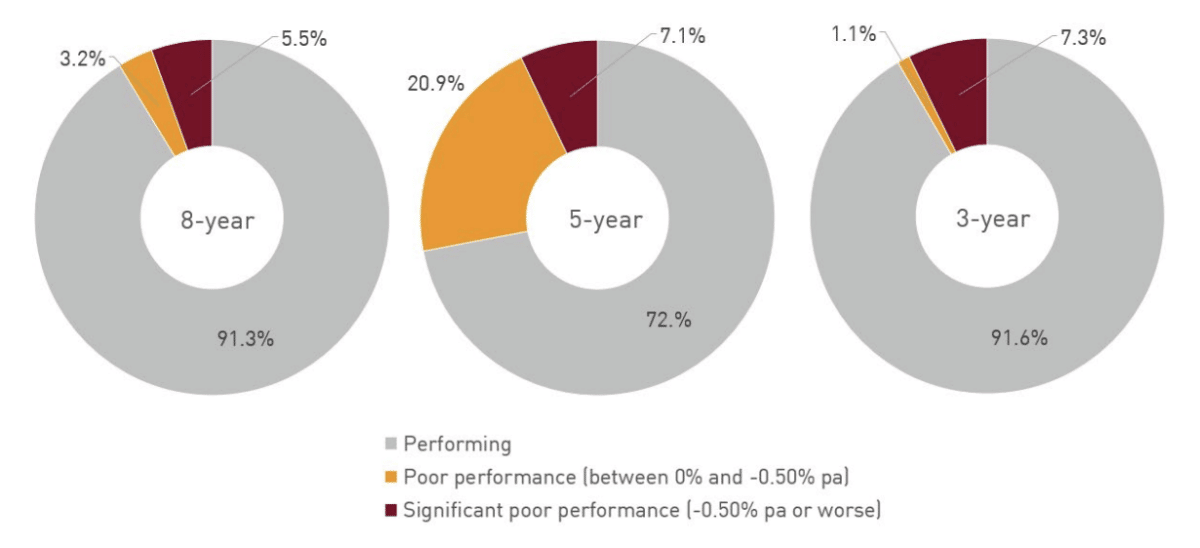
Source: APRA
Fees and costs are falling
While investment returns are the main driver of performance, returns should always be looked at net of fees and costs, which act as a drag on performance.
The good news is that total fees and costs have fallen for most MySuper funds, although expensive products remain. APRA named one fund with significantly high total fees and costs (Qantas Glidepath) and another 13 with high fees and costs.
Since the first heatmap in 2019, fees and costs have fallen for an estimated 8.1 million members, or 56% of member accounts, with the biggest falls in percentage terms for lower account balances.
For a representative member with a $50,000 account balance, total fees and costs have fallen from $523 in 2021 to $488 for the median product in the 2022 heatmap, and now sit below 1% of asset value. This includes a fall in median administration fees from $160 to $143.
Trend of total fees and costs ($50,000 account balance)
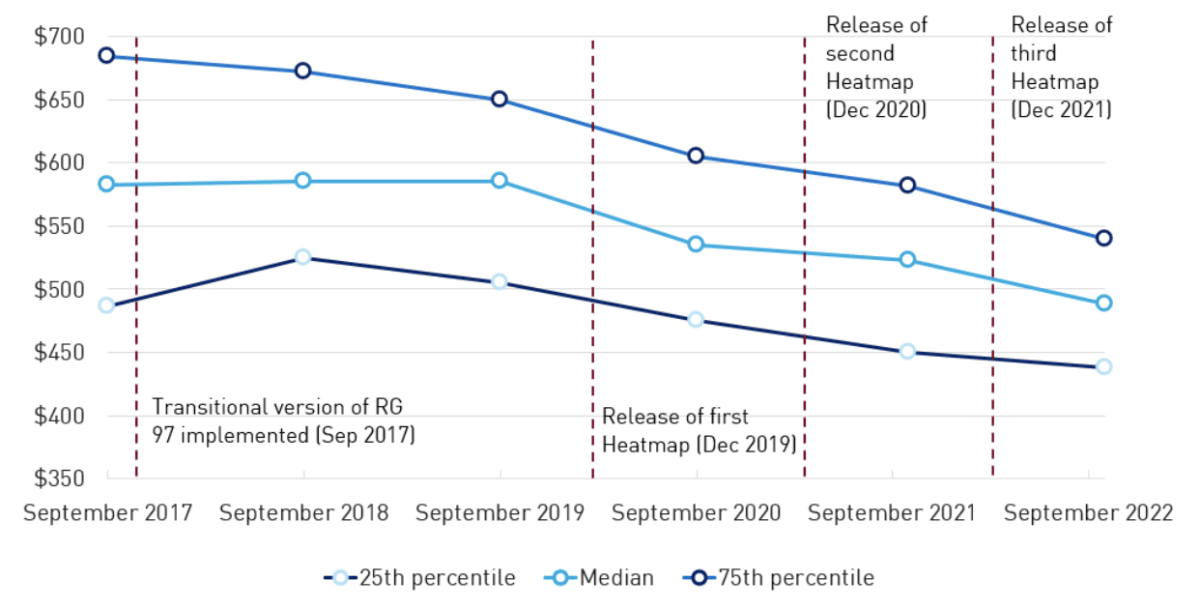
Source: APRA
How MySuper funds performed
The following table lists how all MySuper funds performed against the benchmarks over 8 years (to 30 June 2022), with the best performers at the top, and the worst performers at the bottom.
| Super fund | Investment option | Single strategy or lifecycle? | Performance against benchmarks | Pass or Fail |
|---|---|---|---|---|
| Unisuper | UniSuper Balanced | Single strategy | 1.56% | Pass |
| Meat Industry Employees Superannuation Fund (MIESF) | MIESF MySuper | Single strategy | 1.54% | Pass |
| Goldman Sachs & JBWere Superannuation Fund | Goldman Sachs & JBWere Superannuation Fund – MySuper Product | Single strategy | 1.38% | Pass |
| Hostplus | Balanced option | Single strategy | 1.32% | Pass |
| AMP Super Fund | Macquarie Group MySuper | Single strategy | 1.22% | Pass |
| First Super | First Super MySuper | Single strategy | 1.21% | Pass |
| Australian Retirement Trust | QSuper Lifetime | Lifecycle | 1.16% | Pass |
| AustralianSuper | AustralianSuper MySuper | Single strategy | 1.14% | Pass |
| Australian Meat Industry Superannuation Trust (AMIST) | AMIST MySuper | Single strategy | 0.97% | Pass |
| Australian Retirement Trust | Super Savings – Lifecycle Investment Strategy | Lifecycle | 0.87% | Pass |
| Care Super | CareSuper | Single strategy | 0.85% | Pass |
| Cbus Super | Growth (Cbus MySuper) | Single strategy | 0.78% | Pass |
| Australian Ethical Retail Superannuation Fund | Balanced (accumulation) | Single strategy | 0.76% | Pass |
| Aware Super | MySuper Lifecycle | Lifecycle | 0.64% | Pass |
| Public Sector Superannuation Accumulation Plan | PSSap MySuper Balanced | Single strategy | 0.62% | Pass |
| equipsuper | Equipsuper MySuper | Single strategy | 0.61% | Pass |
| Qantas Superannuation Plan | Glidepath | Lifecycle | 0.60% | Pass |
| Australian Defence Force Superannuation Scheme | ADF MySuper | Single strategy | 0.57% | Pass |
| Aware Super | VicSuper Growth (MySuper)~ | Single strategy | 0.57% | Pass |
| Spirit Super | Balanced (MySuper) | Single strategy | 0.50% | Pass |
| legalsuper | MySuper Balanced | Single strategy | 0.46% | Pass |
| Local Authorities Superannuation Fund | Vision MySuper | Single strategy | 0.44% | Pass |
| HESTA | HESTA MySuper | Single strategy | 0.44% | Pass |
| Prime Super | MySuper | Single strategy | 0.41% | Pass |
| Mercy Super | MySuper Balanced | Single strategy | 0.41% | Pass |
| IOOF Portfolio Service Superannuation Fund | IOOF MySuper | Single strategy | 0.35% | Pass |
| Rei Super | Balanced | Single strategy | 0.32% | Pass |
| AMP Super Fund | Woolworths Group MySuper | Single strategy | 0.32% | Pass |
| Lutheran Super | Balanced Option – MySuper Compliant | Single strategy | 0.27% | Pass |
| MLC Super Fund | NAB Staff MySuper | Single strategy | 0.26% | Pass |
| NGS Super | Diversified (MySuper) | Single strategy | 0.22% | Pass |
| Local Government Super | Active Super Lifestage Product | Lifecycle | 0.22% | Pass |
| SPSL Master Trust | Suncorp Lifestage Funds | Lifecycle | 0.17% | Pass |
| MLC Super Fund | MySuper | Lifecycle | 0.16% | Pass |
| Telstra Superannuation Scheme | Telstra Super MySuper | Lifecycle | 0.08% | Pass |
| The Bendigo Superannuation Plan | Bendigo MySuper | Lifecycle | 0.07% | Pass |
| Mercer Super Trust | Mercer WGSP MySuper | Lifecycle | 0.05% | Pass |
| ANZ Australian Staff Superannuation Scheme | ANZ Staff MySuper | Single strategy | 0.05% | Pass |
| AMP Super Fund | AFLPA & AFL Industry MySuper | Lifecycle | 0.04% | Pass |
| Mercer Super Trust | Virgin Money MySuper | Lifecycle | -0.01% | Pass |
| Mercer Super Trust | Mercer Santos MySuper | Lifecycle | -0.01% | Pass |
| equipsuper | MyCatholicSuper | Lifecycle | -0.05% | Pass |
| NESS Super | NESS MySuper | Single strategy | -0.06% | Pass |
| Christian Super | My Ethical Super | Single strategy | -0.07% | Pass |
| Commonwealth Bank Group Super | Accumulate Plus Balanced | Single strategy | -0.09% | Pass |
| Maritime Super | MySuper Investment Option | Single strategy | -0.11% | Pass |
| Smart Future Trust | smartMonday Lifecycle | Lifecycle | -0.11% | Pass |
| AMP Super Fund | AMP MySuper No.3 | Lifecycle | -0.13% | Pass |
| LGIAsuper | LGIASuper MySuper | Single strategy | -0.17% | Pass |
| TWU Superannuation Fund | Balanced (MySuper) | Single strategy | -0.20% | Pass |
| Guild Retirement Fund | Guild Retirement Fund (MySuper) | Lifecycle | -0.22% | Pass |
| Retail Employees Superannuation Trust | REST Super | Single strategy | -0.23% | Pass |
| Mercer Super Trust | Mercer SmartPath | Lifecycle | -0.26% | Pass |
| OneSuper | MySuper Passive Balanced | Single strategy | -0.31% | Pass |
| Building Unions Superannuation Scheme (Queensland) | BUSSQ MySuper | Single strategy | -0.33% | Pass |
| Russell Investments Master Trust | GoalTracker | Lifecycle | -0.34% | Pass |
| Mine Superannuation Fund | Default Lifecycle | Lifecycle | -0.35% | Pass |
| OnePath Custodians Retirement Portfolio Service | ANZ Smart Choice Super for QBE Management Services Pty Ltd and their employees | Lifecycle | -0.37% | Pass |
| OnePath Custodians Retirement Portfolio Service | ANZ Smart Choice Super for employers and their employees | Lifecycle | -0.40% | Pass |
| Commonwealth Essential Super | Essential Super | Lifecycle | -0.42% | Pass |
| Colonial First State FirstChoice Superannuation Trust | FirstChoice Employer Super | Lifecycle | -0.43% | Pass |
| AvSuper Fund | AvSuper Growth (MySuper) | Single strategy | -0.47% | Pass |
| AMG Super | AMG MySuper | Single strategy | -0.67% | Fail – second consecutive time |
| BT Funds Management Retirement Wrap | Westpac Group Plan MySuper | Lifecycle | -0.73% | Fail |
| Australian Catholic Superannuation and Retirement Fund | LifetimeOne | Lifecycle | -0.79% | Fail – second consecutive time |
| BT Funds Management Retirement Wrap | BT Super MySuper | Lifecycle | -1.02% | Fail – second consecutive time |
| Energy Industries Superannuation Scheme-Pool A (EISS Super) | Balanced (MySuper) | Single strategy | -1.49% | Fail – second consecutive time |
Source: APRA

Leave a Reply
You must be logged in to post a comment.