
In this guide
In uncertain times, when markets are volatile, it’s easy to conclude that it’s time to move all your assets into the safe haven of cash or something tangible like property. For those nearing retirement, these kinds of concerns are heightened, as pre-retirees watch money earmarked for retirement income dwindle overnight.
In an environment of rising interest rates, uncertainty around inflation, and the war in Ukraine, keeping the faith and sticking to your investment strategy can seem harder than ever. Nevertheless, the core principles of investing remain and are critical at times like this. When it comes to investing, decisions made in response to fear are rarely the right ones and taking rash action can prove costly.
Lessons from history
The oft-quoted maxim when markets take a dive is, “It’s not about timing the market it’s about time in the market”. While that may seem trite – particularly if your superannuation balance has just been decimated – it’s helpful to take a look at history and how markets have recovered over time.
AMP Capital head of investment strategy and economics and chief economist Shane Oliver has been analysing market data as part of his role for nearly two decades. He’s worked through the tech bubble and the global financial crisis and his analysis of over 100 years of market data is telling.
The following chart shows how $100 would have performed in the period to May 2022 if invested in various asset classes in 1926 (with all dividends, rents and interest earned reinvested).
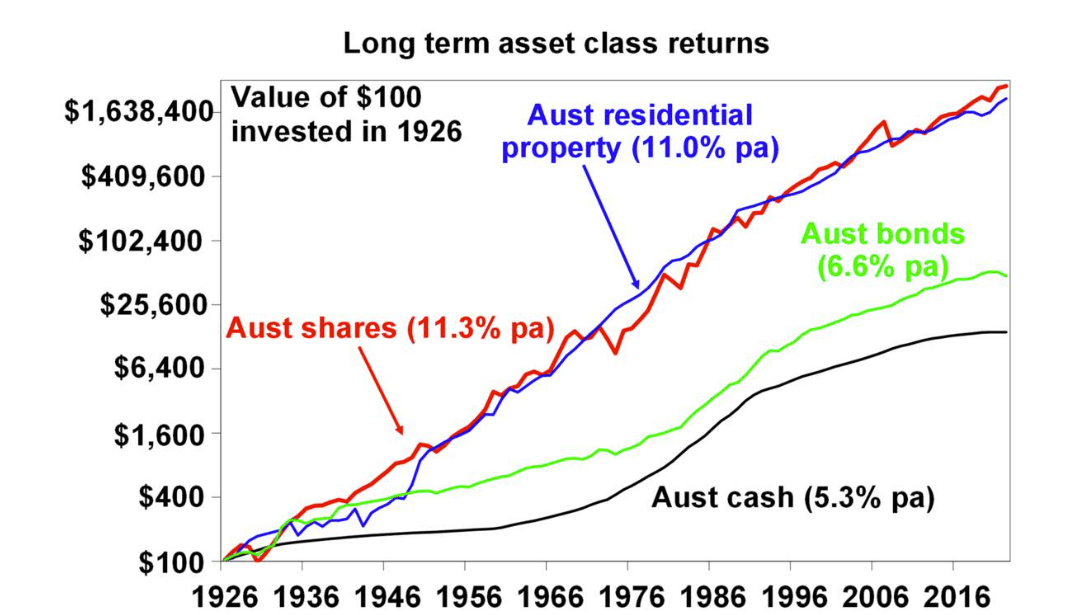
Source: ABS, ASX, Bloomberg, REIA, AMP Capital
There are obvious blips, like the decade between 1926 and 1936 when Australia was experiencing the Great Depression. But by the end of that decade, $100 invested in Australian equities in 1926 has nearly quadrupled.
It’s easier said than done to hold your nerve during a market meltdown like the one we experienced in 2020, and the continuing volatility of 2022. During a market panic our fight or flight response kicks in. But the risk of fleeing to the perceived safety of cash is twofold; not only do you risk crystallising your losses after a big market fall, but you also risk missing the rebound in shares before you switch back again.
In 2021, SuperRatings measured the impact of switching out of a balanced or growth option into cash at the start of the pandemic. SuperRatings executive director Kirby Rappell said someone with a super balance of $100,000 in January 2020 who switched to cash at the end of March 2020 would have been around $22,000–$27,000 worse off by the end of July 2021 than if they had not switched.
Shane Oliver also illustrates this point clearly with the chart below, showing the outcome of missing the best or worst days in the Australian share market. While it might be tempting to focus on the outcome of missing the worst days by correctly timing the market, in practice this is almost impossible. Typical investors instead tend to get out after the worst days have occurred and miss the best days in the recovery, damaging longer-term returns.
Take the example of missing the best 20 days in the 27 years between 1995 and 2022. This erodes the total return from 9.5% per year for an investor who stayed the course to 5.8% per year for the investor who missed those crucial days.
Make your super work harder – for free

Get practical, independent guidance to help you grow your balance, save tax and make smarter super decisions with a free SuperGuide account.
Find out more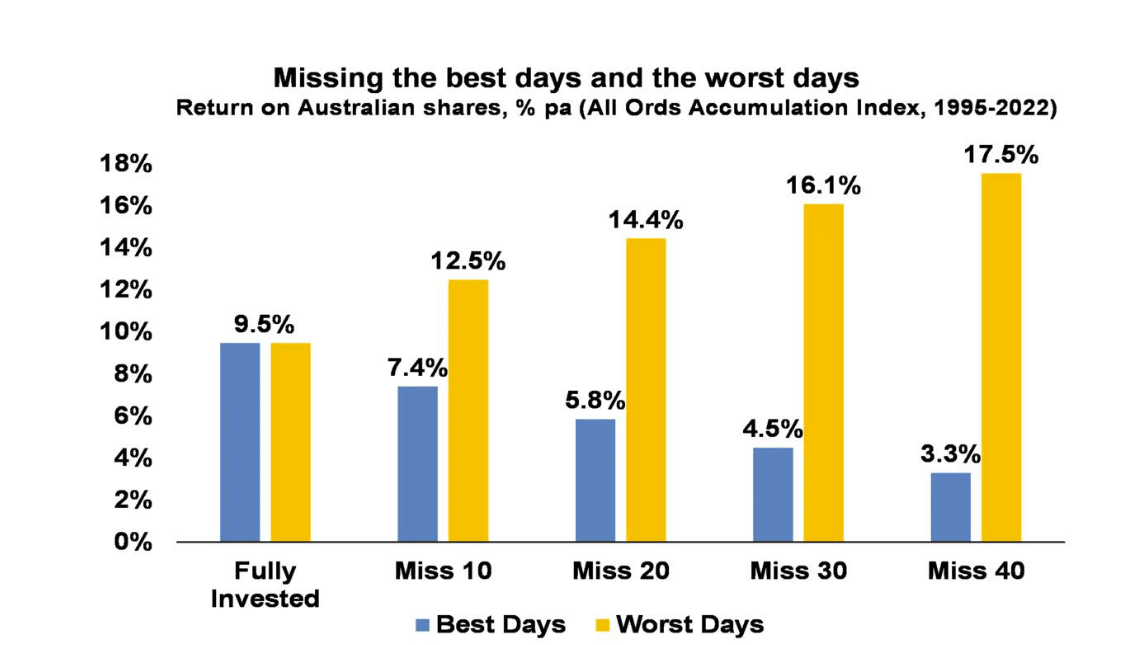
Source: Bloomberg, AMP
What to do instead?
First, it is prudent to review your investment strategy frequently and ensure it still fits your needs. You might be happy with a portfolio focused on growth assets when you have many years prior to retirement to recover any losses, but the same strategy is unlikely to be suitable when you’re approaching retirement. When you’re confident your strategy is right for you, you’re less likely to switch after a loss, and the right strategy near retirement should be geared to prevent losses disrupting your retirement plans.
Diversification
The best-performing asset class changes dramatically from year to year – last year’s superstar can be this year’s biggest loser. It makes sense to maintain a portfolio that contains a combination of a wide range of asset classes so that when one is performing poorly the others can cushion the blow.
Luckily, most super funds do the work for you and provide pre-mixed diversified options for you to choose from. If you have a self-managed super fund (SMSF) you’ll need to do it yourself, in co-operation with your adviser.
Look away
It might seem counterintuitive but paying a lot of attention to your returns is not necessarily a good thing. If you track the Australian share market daily, it is down almost as often as it is up, giving you bad news nearly 50% of the time. If you only check once per year, the market is up about 80% of the time, and if we stretch it to looking once per decade, Australian shares have delivered positive returns 100% of the time since 1900.
If volatility keeps you up at night, it can be best to look less frequently at your investments and super balance. You’ll get a better feel for how things are going in the long run rather than worrying unnecessarily over daily fluctuations.
Dollar cost averaging
One of the more recognised strategies for dealing with market volatility is dollar cost averaging. This refers to the practice of acquiring assets gradually over time, instead of all at once, ensuring price volatility is smoothed.
Investing a small amount at regular intervals instead of one lump sum means that fewer assets are purchased when prices are high and more are purchased when prices are low, enhancing the overall return.
Dollar cost averaging is effective in a volatile or falling market but doesn’t provide an advantage if asset prices are consistently rising. That said, predicting where markets are heading is near impossible, so dollar cost averaging is a good way to take the guesswork out of investing and sleep well at night.
The best news is that if you’re making regular super contributions (or have an employer doing so for you), dollar cost averaging happens automatically.
The bottom line
Market timing is a very difficult game and one that even the best of professional investors struggle with. Legendary investor Warren Buffett, chairman of investment company Berkshire Hathaway, had this to say about market direction in an interview following the release of his annual shareholder letter.
“You really can’t predict the market by reading the daily newspaper, that is for sure. And you certainly can’t predict the market by listening to me.”
Make your super work harder – for free
Get practical, independent guidance to help you grow your balance, save tax and make smarter super decisions with a free SuperGuide account.
Find out moreRather than trying to achieve the impossible, the successful investor is patient and sticks to the fundamental principles of diversification, appropriate asset allocation and giving the market time to reap the benefits of compounding returns.
Get more guides like this with a free account
better super and retirement decisions.
Leave a Reply
You must be logged in to post a comment.