
In this guide
On this page you can find the quartile performance and quartile rankings for super fund investment options in the All Growth category over eight timeframes to 31 March 2026.
Chant West’s All Growth category includes investment options with 96–100% growth assets, such as shares and property, with the balance in more conservative assets such as bonds.
What is a quartile?
Quartiles divide a range of data points into four roughly equal groups which can then be ranked according to their performance.
For example there may be 40 investment options that are all categorised as Balanced. The performance of these investment options is then analysed over various periods from 3 months to 15 years.
For each time period the 40 investment options are then divided into four groups of 10. The 10 investment options that have the highest performance are ranked in Quartile 1. The 10 investment options that have the next highest performance are ranked in Quartile 2. The following 10 are ranked in Quartile 3 and the bottom 10 are in Quartile 4.
You can then easily scan the tables to identify that the 1s are the best performers for a particular time period, and the 4s are the worst performers.
The first table below gives the median performance of investment options in the top and bottom quartiles, along with the median investment option’s performance. The median investment option is the one that appears halfway down the rankings. The second table shows the quartile ranking for each investment option.
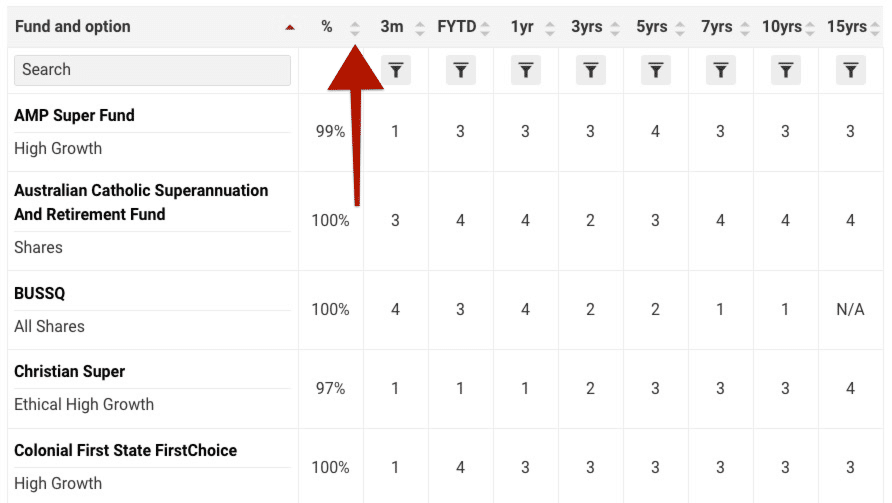
How do I filter or sort the results?
You can filter using the filter buttons in each column.
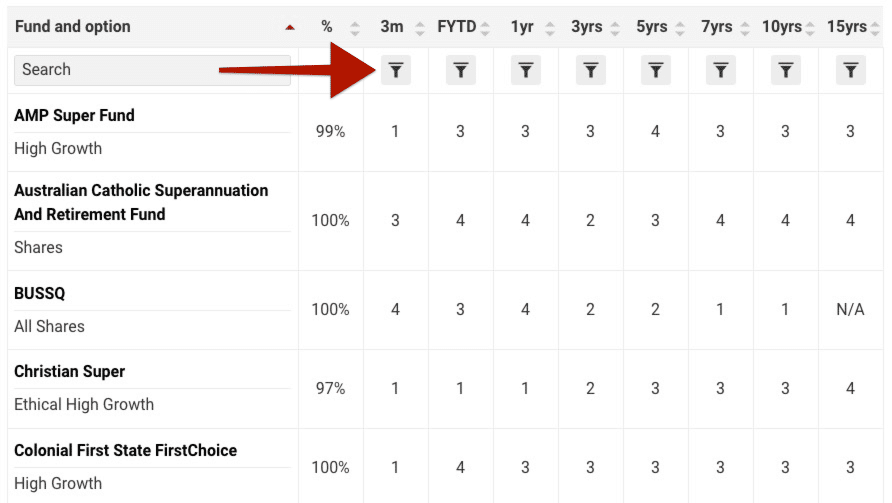
You can sort by clicking the arrows in each column.
All Growth category: Quartile performance
The table below shows the quartile performance for the top and bottom quartiles, and for the median investment option in the All Growth category to 31 March 2026.
| Quartile | % of growth assets | 3 mths | FYTD | 1 yr | 3 yrs (per yr) | 5 yrs (per yr) | 7 yrs (per yr) | 10 yrs (per yr) | 15 yrs (per yr) |
|---|---|---|---|---|---|---|---|---|---|
| Upper Quartile | – | – | – | – | – | – | – | – | – |
| Median | 99.0 | -3.3% | 3.2% | 10.1% | 11.1% | 8.0% | 8.9% | 9.6% | 9.3% |
| Lower Quartile | – | – | – | – | – | – | – | – | – |
All Growth category: Quartile rankings for periods to 31 March 2026
The table below shows the quartile performance rankings for super fund investment options in the All Growth category.
Quartile rankings are based on performance that is net of investment fees and tax but before admin fees. N/A or 0 means not available for that time period.
| Fund and option | % | 3m | FYTD | 1yr | 3yrs | 5yrs | 7yrs | 10yrs | 15yrs |
|---|---|---|---|---|---|---|---|---|---|
|
Just Shares
|
100% | 4 | 3 | 3 | 1 | 1 | 1 | 1 | 1 |
|
High Growth
|
97.3% | 4 | 4 | 4 | 2 | 2 | 3 | 2 | 3 |
|
High Growth
|
96% | 2 | 2 | 4 | 3 | 3 | 1 | 1 | 1 |
|
Future Directions High Growth
|
97.8% | 1 | 1 | 2 | 1 | 1 | 2 | 3 | 2 |
|
High Growth
|
100% | 1 | 1 | 1 | N/A | N/A | N/A | N/A | N/A |
|
CFS High Growth
|
99% | 2 | 4 | 2 | 4 | 4 | 4 | 4 | 4 |
|
Growth Plus
|
99% | 3 | 2 | 1 | N/A | N/A | N/A | N/A | N/A |
Other risk categories
Listed below are the super and pension rankings for all risk categories:


Best performing super and pension funds
Listed below are the best performing super and pension funds for all risk categories:
Learn more about comparing super funds in the following SuperGuide articles:


© Zenith CW Pty Ltd ABN 20 639 121 403 (Chant West), Authorised Representative of Zenith Investment Partners Pty Ltd ABN 27 103 132 672, AFSL 226872 under AFS Representative Number 1280401 2020.
The data provided by Chant West is based on information supplied by third parties and does not contain all the information required to evaluate the nominated service providers, you are responsible for obtaining further information as required. The data provided by Chant West does not constitute financial product advice. However, to the extent that this data is advice it is General Advice (s766B Corporations Act) and Chant West has not taken into account the objectives, financial situation or needs of any specific person who may access or use this data. It is not a specific recommendation to purchase, sell or hold any product(s) and is subject to change at any time without prior notice. Individuals should consider the appropriateness of any advice in light of their own objectives, financial situations or needs and should obtain a copy of and consider any relevant PDS or offer document before making any decision. Data is provided in good faith and is believed to be accurate, however, no representation, warranty or undertaking in relation to the accuracy or completeness of the data is provided. Data provided is subject to copyright and may not be reproduced, modified or distributed without the consent of the copyright owner. Except for any liability which can not be excluded, Chant West does not accept any liability whether direct or indirect, arising from use of this data. Past performance is not an indication of future performance. Full details regarding Chant West’s research methodology, processes, ratings definitions are available at www.chantwest.com.au and Chant West’s Financial Services Guide is available at www.chantwest.com.au/financial-services-guide.
Get more guides like this with a free account
better super and retirement decisions.